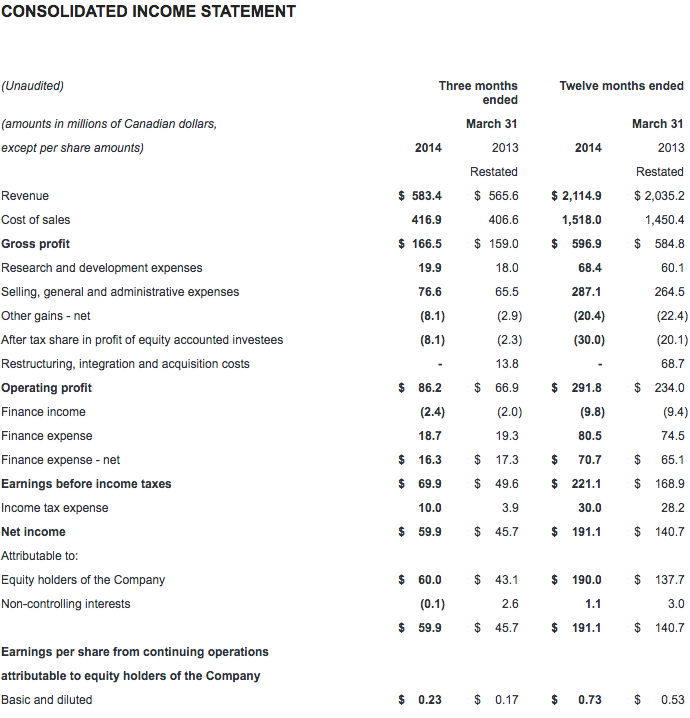
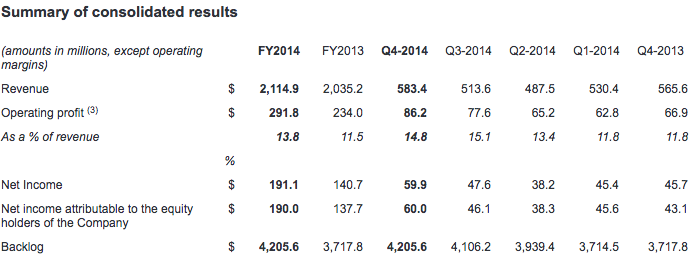
CAE today reported financial results for the fourth quarter and full-year ended March 31, 2014. Net income attributable to equity holders was $60.0 million ($0.23 per share) this quarter, compared to $43.1 million ($0.17 per share) in the fourth quarter last year. Net income attributable to equity holders for the full year was $190.0 million ($0.73 per share), compared to $137.7 million ($0.53 per share) last year. Revenue for the quarter was $583.4 million, compared to $565.6 million in the fourth quarter last year. For the year, revenue was $2,114.9 million, compared to $2,035.2 million last year. All financial information is in Canadian dollars.
"I am pleased with our performance in the quarter and to have reached record revenue and order backlog for the year," said Marc Parent, CAE's President and Chief Executive Officer. "Our operational discipline and customer focus continued to drive positive results. Civil is back on track with operating margins in the high teens and Military is proving resilient with continued growth. For the year, our balance sheet became even stronger and we generated free cash flow in excess of net income. Order backlog reached $4.2 billion, including a record 48 Civil full-flight simulator sales and long term Military contracts on new platforms for CAE. We are well positioned for growth and look forward to more success in fiscal year 2015."
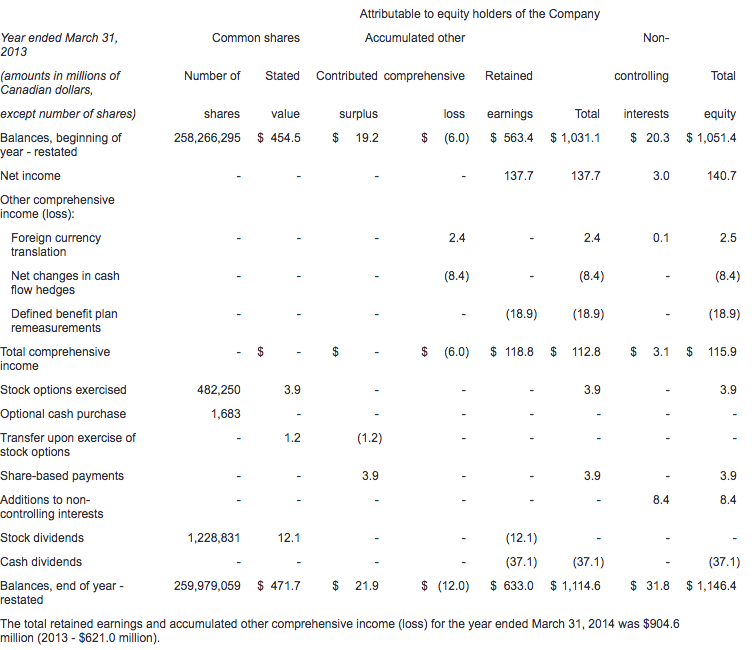
Summary of consolidated results
Civil segments
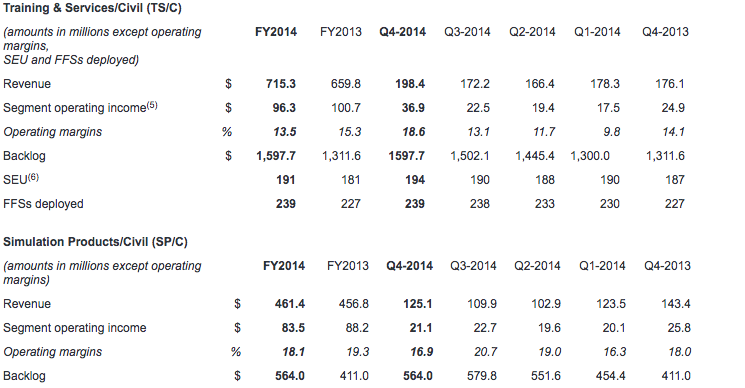
Revenue for our combined Civil segments was $323.5 million in the fourth quarter, compared to $319.5 million last year. Fourth quarter operating income was $58.0 million (17.9% of revenue), compared to $50.7 million (15.9% of revenue) last year.
Annual revenue was $1,176.7 million compared to $1,116.6 million the prior year. Annual operating income was $179.8 million (15.3% of revenue), compared with $188.9 million (16.9% of revenue).
During the quarter we signed long-term training and services agreements with airlines and operators in Europe and the Americas, and we received 8 FFS orders from customers including Southwest Airlines and Lufthansa Flight Training. For the fiscal year, we set a record with 48 FFS sales, and since the start of the new fiscal year we have announced another 4 FFS orders. We received $350.1 million in combined civil segment orders this quarter for a book-to-sales(4) ratio of 1.08x. Book-to-sales ratio for the year was 1.28x. Fourth quarter Civil backlog was $2.2 billion.
Military segments
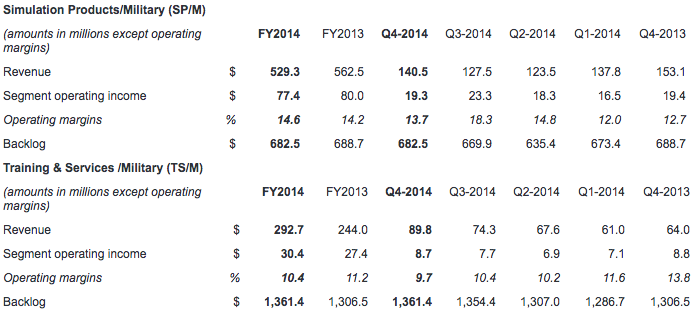
Revenue for our combined Military segments was up 6% in the fourth quarter at $230.3 million, compared to $217.1 million last year. Fourth quarter operating income was $28.0 million (12.2% of revenue), compared to $28.2 million (13.0% of revenue) last year.
Annual revenue was $822.0 million, up 2% from $806.5 million the prior year. Annual operating income was $107.8 million (13.1% of revenue), compared with $107.4 million (13.3% of revenue) last year.
During the quarter, we booked simulator and training system contracts involving the T-6C aircraft for the Royal New Zealand Air Force and Mexican Air Force; the SW-4 helicopter for the Polish Air Force; and the P-8A Poseidon aircraft for the US Navy. We also booked upgrade contracts for C130 Hercules customers worldwide and support services contracts in Europe and Southeast Asia. In total, we received $189.0 million in combined military segment orders this quarter, representing a book-to-sales ratio of 0.82x. Book-to-sales ratio for the year was 0.92x. Fourth quarter Military backlog was $2.0 billion and we had an additional $406.7 million of unfunded backlog(7).
New Core Markets
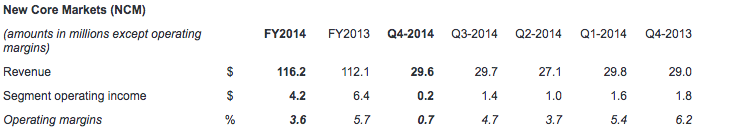
Revenue in New Core Markets was $29.6 million for the quarter, compared to $29.0 million in the fourth quarter last year. Operating income was $0.2 million compared to $1.8 million last year. Annual revenue was $116.2 million, compared to $112.1 million the prior year. Annual operating income was $4.2 million compared to $6.4 million last year.
In CAE Healthcare, we continued to invest segment profits into the development of new products and broadening our sales capabilities. We booked product sales with universities and hospitals in the U.K., U.S., and the Middle East for our centre management systems, ultrasound simulators, surgical simulators and patient simulators. In CAE Mining, we sold resource modeling and mine planning systems to customers globally.
Additional financial highlights
Income taxes this quarter were $10.0 million representing an effective tax rate of 14%, compared to 19% last quarter and 8% last year. The decrease in the effective tax rate from the last quarter was mainly due to a change in the substantively enacted tax rates of Germany, United Kingdom and Norway, the settlement of tax audits, as well as the change in the mix of income from various jurisdictions. Excluding the effect of the change in the tax rates and the settlement of tax audits, the income tax rate for the quarter would have been 21%.
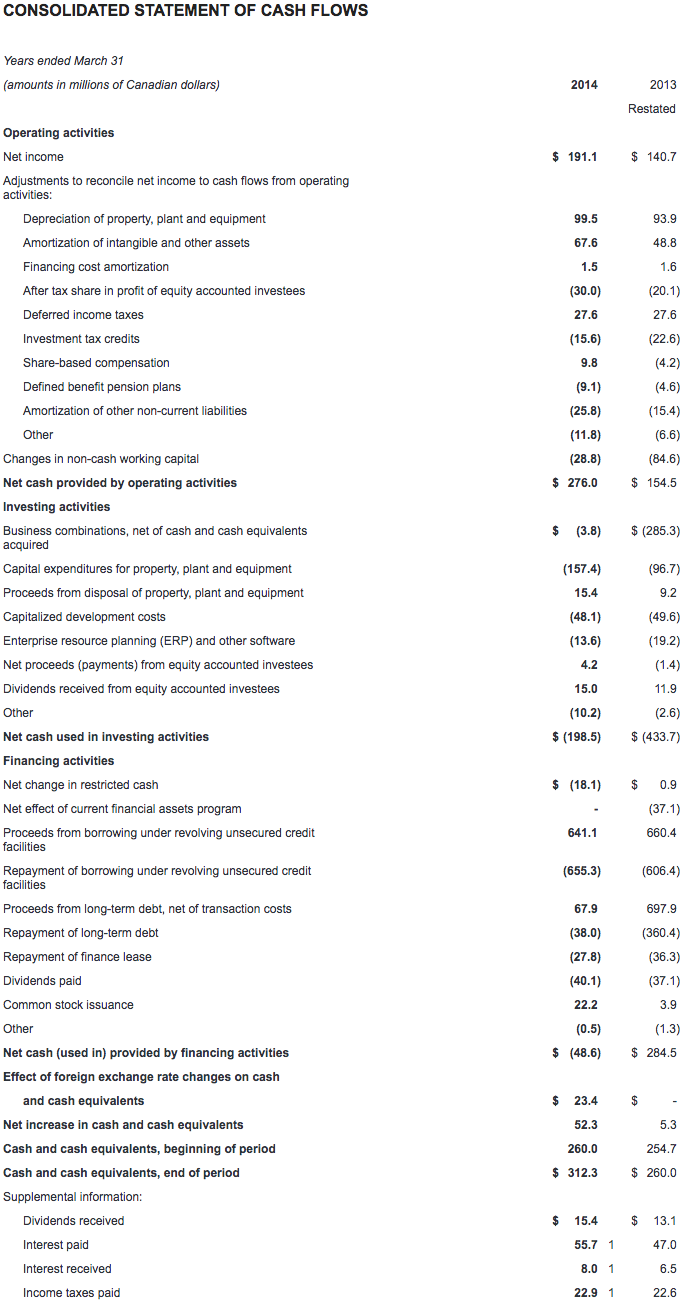
Free cash flow was positive $105.1 million for the fourth quarter and $200.6 million for the year, representing a 105% conversion of annual net income into cash. The increase was mainly due to favourable changes in non-cash working capital(8) and an increase in cash provided by operating activities.
Capital expenditures(9) totaled $65.7 million this quarter and $157.4 million for the year. Growth capital expenditures represented 71% of the annual total, and maintenance capital expenditures the remaining 29%.
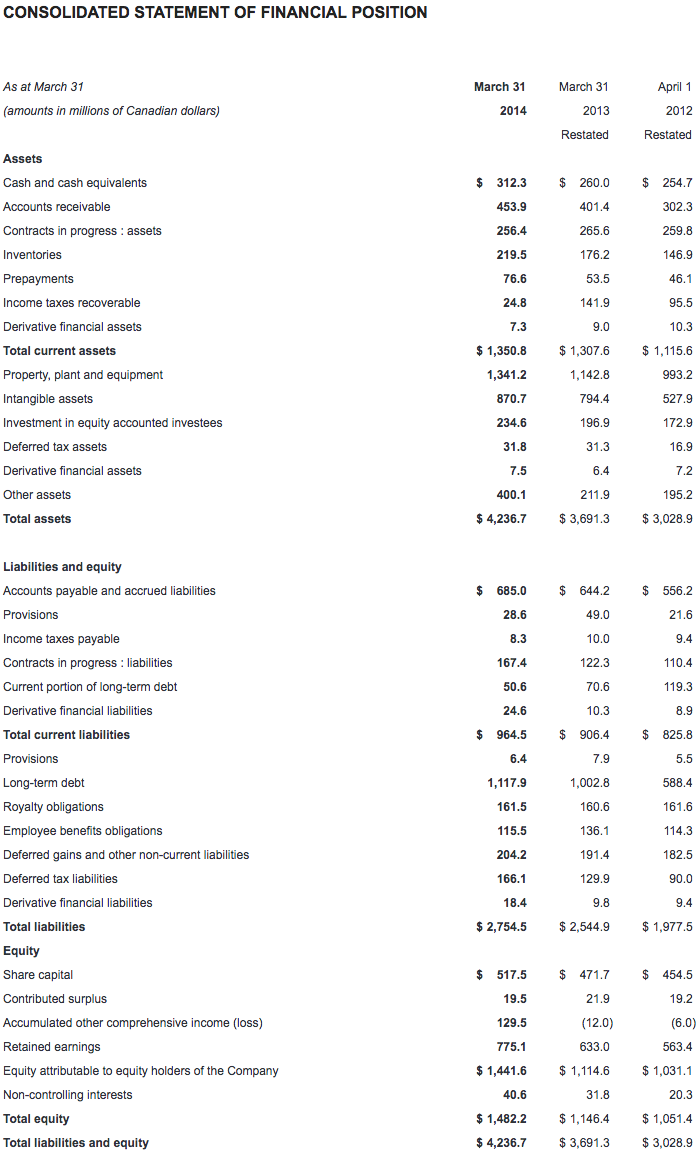
Net debt(10) was $856.2 million as at March 31, 2014, compared to $886.5 million as at December 31, 2013. Our net debt-to-total capital(11)ratio decreased to 36.6%.
CAE will pay a dividend of $0.06 per share effective June 30, 2014 to shareholders of record at the close of business on June 13, 2014.
Additional information
You will find a more detailed discussion of our results by segment in the Management's Discussion and Analysis (MD&A) as well as in our consolidated interim financial statements which are posted on our website at www.cae.com/investors.
CAE's unaudited consolidated interim financial statements and management's discussion and analysis for the quarter ended March 31, 2014 have been filed with the Canadian securities commissions and are available on our website (www.cae.com) and on SEDAR (www.sedar.com). They have also been filed with the U.S. Securities and Exchange Commission and are available on their website (www.sec.gov).
Conference call Q4 and full-year FY2014
CAE will host a conference call focusing on fiscal year 2014 fourth quarter and full-year results today at 1:00 p.m. ET. The call is intended for analysts, institutional investors and the media. Participants can listen to the conference by dialling + 1 877 586 3392 or +1 416 981 9024. The conference call will also be audio webcast live for the public at www.cae.com.
CAE is a global leader in providing comprehensive training solutions based on world-leading simulation technology and integrated training services. The company employs 8,000 people at more than 160 sites and training locations in 35 countries. Our vision is to be our customers' Partner of Choice and we take a long-term approach to customer relationships. We offer our civil aviation and defence and security customers a complete range of highly innovative product, service and training centre solutions designed to help them meet their mission critical needs for safety, efficiency and readiness. We provide similar solutions to customers in healthcare and mining. CAE has the largest installed base of civil and military flight simulators, supported by a range of after-sales services, and has been serving the needs of its customers for nearly 70 years. We have the broadest training services network in the world and offer civil aviation, military and helicopter training services in 67 locations worldwide and train more than 120,000 civil and military crewmembers annually. www.cae.com
You will find more information about the risks and uncertainties associated with our business in the MD&A section of our annual report and annual information form for the year ended March 31, 2013. These documents have been filed with the Canadian securities commissions and are available on our website (www.cae.com), on SEDAR (www.sedar.com) and a free copy is available upon request to CAE. They have also been filed with the U.S. Securities and Exchange Commission under Form 40-F and are available on EDGAR (www.sec.gov). The forward-looking statements contained in this news release represent our expectations as of May 15, 2014 and, accordingly, are subject to change after this date. We do not update or revise forward-looking information even if new information becomes available unless legislation requires us to do so. You should not place undue reliance on forward-looking statements.
Non-GAAP and other financial measures
This press release includes non-GAAP and other financial measures. Non-GAAP measures are useful supplemental information but may not have a standardized meaning according to GAAP. These measures should not be confused with, or used as an alternative for, performance measures calculated according to GAAP. They should also not be used to compare with similar measures from other companies. Management believes that providing certain non-GAAP measures provides users with a better understanding of our results and trends and provides additional information on our financial and operating performance.
(1) Backlog is a non-GAAP measure that represents the expected value of orders we have received but have not yet executed.
(2) Free cash flow is a non-GAAP measure that shows us how much cash we have available to invest in growth opportunities, repay debt and meet ongoing financial obligations. We use it as an indicator of our financial strength and liquidity. We calculate it by taking the net cash generated by our continuing operating activities, subtracting maintenance capital expenditures, investment in other assets not related to growth and dividends paid and adding proceeds from the disposal of property, plant and equipment, dividends received from equity accounted investees and proceeds, net of payments, from equity accounted investees.
(3) Operating profit is non-GAAP measure that shows us how we have performed before the effects of certain financing decisions and tax structures. We track operating profit because we believe it makes it easier to compare our performance with previous periods, and with companies and industries that do not have the same capital structure or tax laws.
(4) The book-to-sales ratio is the total orders divided by total revenue in the period.
(5) Segment operating income (SOI) is a non-GAAP measure and our key indicator of each segment's financial performance. This measure gives us a good indication of the profitability of each segment because it does not include the impact of any items not specifically related to the segment's performance. We calculate it by using segment operating profit, including the after tax share in profit of equity accounted investees and excluding net finance expense, income taxes, restructuring, integration and acquisition costs and other items not specifically related to the segment's performance.
(6) Simulator equivalent unit (SEU) is a financial measure we use to show the total average number of FFSs available to generate earnings during the period.
(7) Unfunded backlog is a non-GAAP measure that represents firm military orders we have received but have not yet executed for which funding authorization has not yet been obtained. We include unexercised negotiated options with a high probability that they will be exercised, but exclude indefinite-delivery/indefinite-quantity (IDIQ) contracts.
(8) Non-cash working capital is a non-GAAP measure we use to monitor how much money we have committed in the day-to-day operation of our business. We calculate it by taking current assets (not including cash and cash equivalents or the current portion of assets held-for-sale) and subtracting current liabilities (not including the current portion of long-term debt or the current portion of liabilities related to assets held-for-sale).
(9) Maintenance capital expenditure is a non-GAAP measure we use to calculate the investment needed to sustain the current level of economic activity. Growth capital expenditure is a non-GAAP measure we use to calculate the investment needed to increase the current level of economic activity.
(10) Net debt is a non-GAAP measure we use to monitor how much debt we have after taking into account liquid assets such as cash and cash equivalents. We use it as an indicator of our overall financial position, and calculate it by taking our total long-term debt, including the current portion of long-term debt, and subtracting cash and cash equivalents.
(11) Net debt-to-capital is calculated as long-term debt, including current portion of long-term debt, less cash and cash equivalents (net debt), divided by the sum of total equity plus net debt.
For a detailed reconciliation of these measures as well as other non-GAAP and other financial measures monitored by CAE, please refer to CAE's management's discussion and analysis filed with the Canadian securities commissions available on our website (www.cae.com) and on SEDAR (www.sedar.com).
Contacts
Investor relations:
Andrew Arnovitz, Vice President, Strategy and Investor Relations (514) 734-5760, [email protected]
Media:
Nathalie Bourque, Vice President, Public Affairs and Global Communications, (514) 734-5788, [email protected]