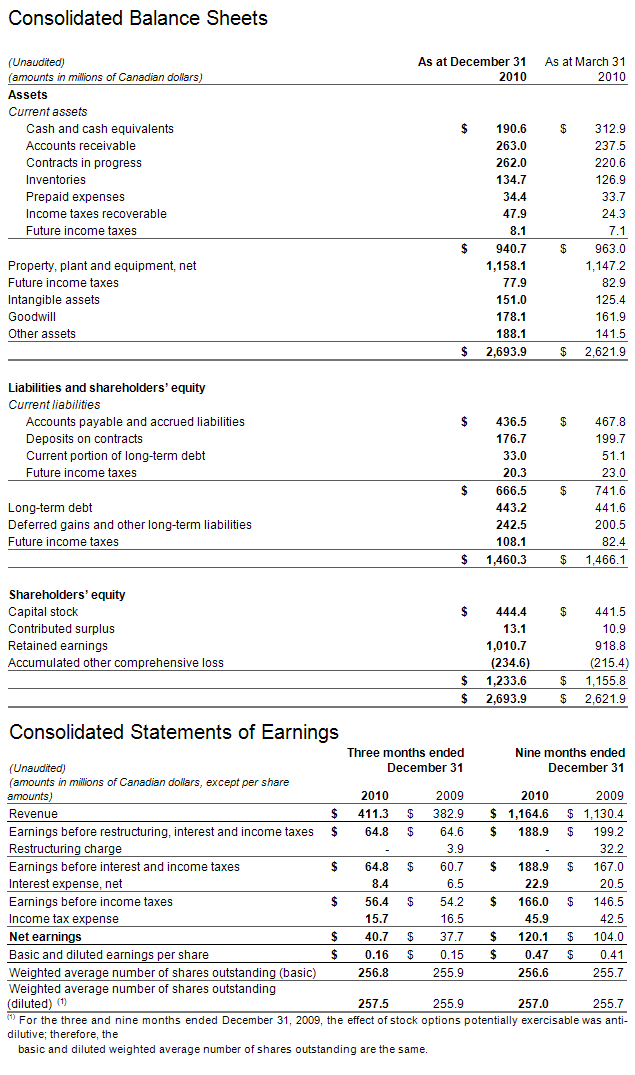

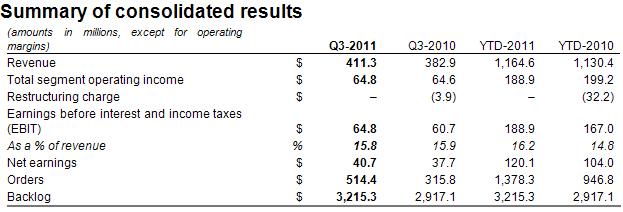
CAE today reported financial results for the third quarter ended December 31, 2010. Net earnings were C$40.7 million (C$0.16 per share), compared to C$37.7 million (C$0.15 per share) in the third quarter of last year. Excluding a restructuring charge last year, earnings were $40.3 million (C$0.16 per share). Revenue was C$411.3 million, 7% higher compared to C$382.9 million in the third quarter last year. All financial information is in Canadian dollars.
“The recovery underway in commercial aerospace led to higher activity in our civil segments during the third quarter, especially in training and services where we signed a number of long term agreements with airlines,” said Marc Parent, CAE’s President and Chief Executive Officer. “In military, we announced a range of strategic program wins, including the $250 million KC-135 training contract for the U.S. Air Force – CAE’s first win as a prime contractor on a major U.S. military Aircrew Training Systems Contract.”
Earnings before interest and taxes(1) (EBIT) were $64.8 million, or 15.8% of revenue.
New Core Markets
We made additional progress in developing our CAE Mining initiative with the acquisition on January 1, 2011 of Century Systems Technologies, a supplier of solutions that complement our offering.
In CAE Healthcare, we sold more of our bedside ultrasound solutions as well as our surgical simulators to customers around the world. After the end of the quarter we launched our CAE Caesar™ trauma patient simulator, which is a high-fidelity patient simulator for training civil and military practitioners responsible for the care of trauma patients in the field.
Additional financial highlights
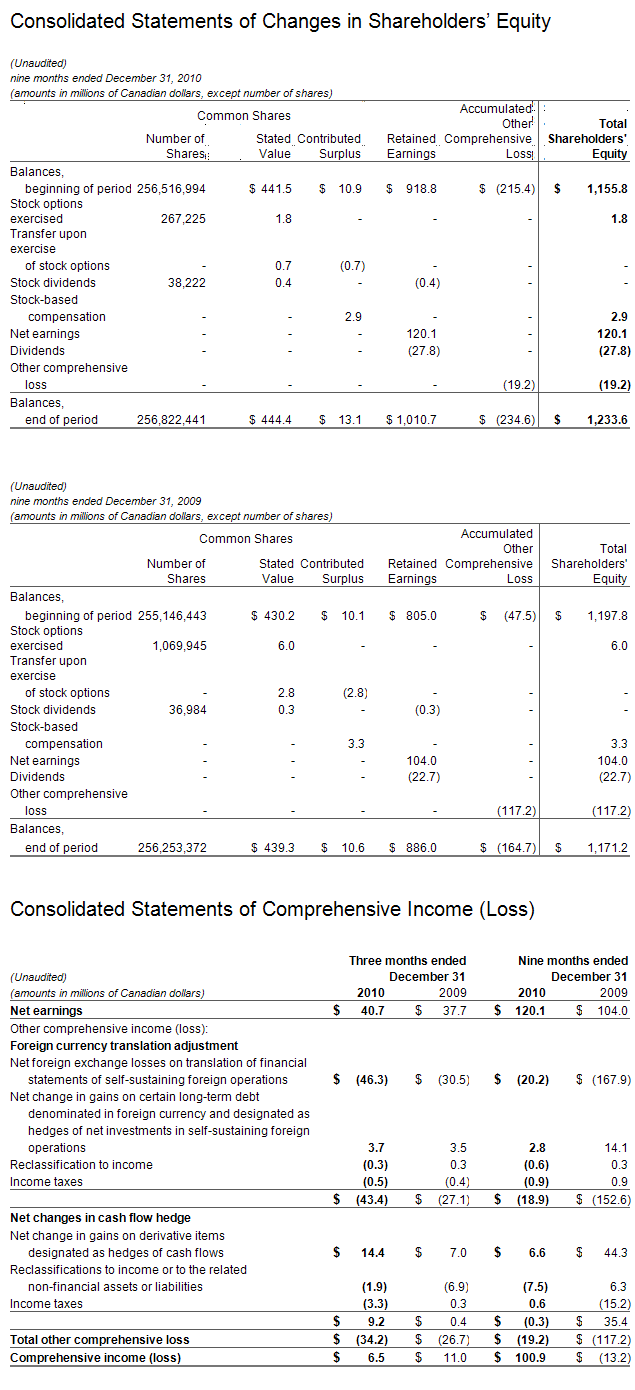
The effect of translating the results of our self-sustaining subsidiaries into Canadian dollars negatively impacted this quarter’s revenue by $16.8 million and net earnings by $2.1 million, when compared to the third quarter of fiscal 2010. For the first nine months of fiscal 2011 the negative translation impact on revenue was $70.1 million and $10.3 million on net earnings.
Income taxes were $15.7 million representing an effective tax rate of 28%, which results from our mix of income from various jurisdictions. Year to date, our effective tax rate is also 28%.
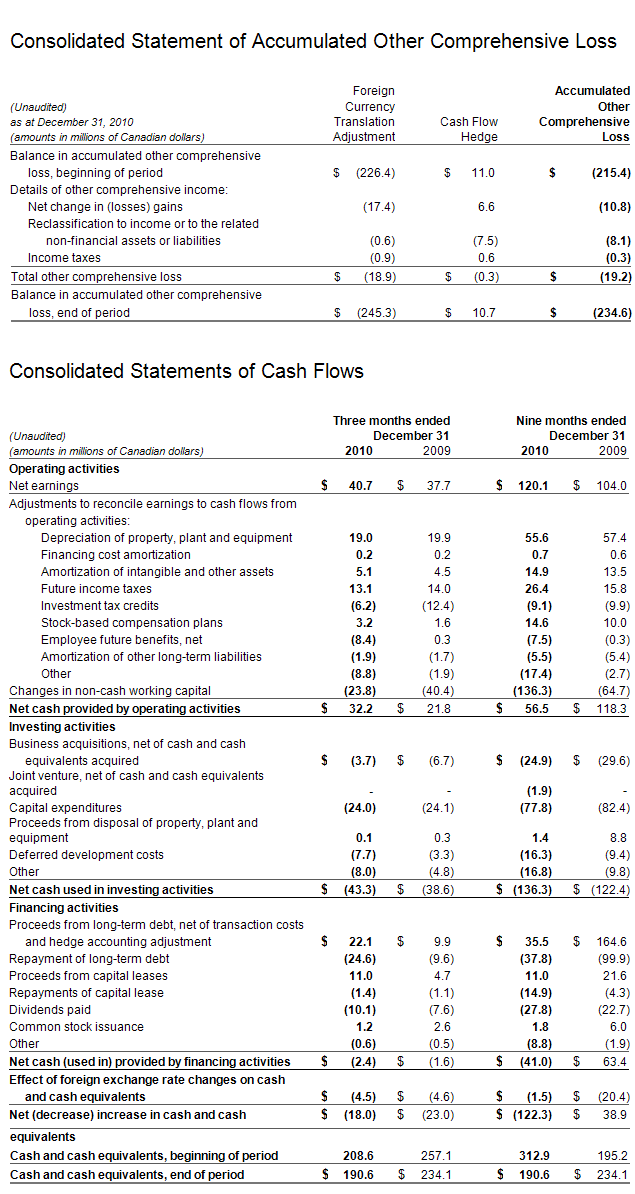
Cash provided by continuing operating activities was $56.0 million and free cash flow(2) was $5.0 million this quarter. We invested $23.8 million in non-cash working capital, mainly in support of a number of contracts involving new aircraft types.
Net debt(3) was $285.6 million as at December 31, 2010, up $7.1 million from last quarter.
CAE will pay a dividend of $0.04 per share on March 31, 2011 to shareholders of record at the close of business on March 15, 2011.
Additional information
You will find a more detailed discussion of our results by segment in the Management’s Discussion and Analysis (MD&A) as well as in our consolidated financial statements which are posted on our website at www.cae.com/Q3FY11.
CAE’s audited annual financial statements and management’s discussion and analysis for the year ended March 31, 2010 have been filed with the Canadian securities commissions and are available on our website (www.cae.com) and on SEDAR (www.sedar.com). They have also been filed with the U.S. Securities and Exchange Commission and are available on their website (www.sec.gov).
Conference call Q3 FY2011
CAE will host a conference call focusing on fiscal year 2011 third quarter financial results today at 12:00 p.m. ET. The call is intended for analysts, institutional investors and the media. Participants can listen to the conference by dialling + 1 800 913-1647 or + 1 416 981-9002. The conference call will also be audio webcast live for the public at www.cae.com.
CAE is a world leader in providing simulation and modelling technologies and integrated training solutions for the civil aviation industry and defence forces around the globe. With annual revenues exceeding C$1.5 billion, CAE employs more than 7,500 people at more than 100 sites and training locations in more than 20 countries. We have the largest installed base of civil and military full-flight simulators and training devices. Through our global network of 30 civil aviation and military training centres, we train more than 80,000 crewmembers yearly. We also offer modelling and simulation software to various market segments and, through CAE’s professional services division, we assist customers with a wide range of simulation-based needs. www.cae.com
Certain statements made in this news release, including, but not limited to, statements that are not historical facts, are forward-looking and are subject to important risks, uncertainties and assumptions. The results or events predicted in these forward-looking statements may differ materially from actual results or events. These statements do not reflect the potential impact of any non-recurring or other special items or events that are announced or completed after the date of this news release, including mergers, acquisitions, or other business combinations and divestitures.
You will find more information about the risks and uncertainties associated with our business in the MD&A section of our annual report and annual information form for the year ended March 31, 2010. These documents have been filed with the Canadian securities commissions and are available on our website (www.cae.com), on SEDAR (www.sedar.com) and a free copy is available upon request to CAE. They have also been filed with the U.S. Securities and Exchange Commission under Form 40-F and are available on EDGAR (www.sec.gov). You will also find on our web site the MD&A for the fiscal 2011 third quarter. The forward-looking statements contained in this news release represent our expectations as of February 9, 2011 and, accordingly, are subject to change after this date. We do not update or revise forward-looking information even if new information becomes available unless legislation requires us to do so. You should not place undue reliance on
forward-looking statements.
Notes
(1) Earnings before interest and taxes (EBIT) is a non-GAAP measure that shows us how we have performed before the effects of certain financing decisions and tax structures. We track EBIT because we believe it makes it easier to compare our performance with previous periods, and with companies and industries that do not have the same capital structure or tax laws.
(2) Free cash flow is a non-GAAP measure that shows us how much cash we have available to build the business, repay debt and meet ongoing financial obligations. We use it as an indicator of our financial strength and liquidity. We calculate it by taking the net cash generated by our continuing operating activities, subtracting maintenance capital expenditures, other assets not related to growth and dividends paid and adding proceeds from sale of property, plant and equipment.
(3) Net debt is a non-GAAP measure we use to monitor how much debt we have after taking into account liquid assets such as cash and cash equivalents. We use it as an indicator of our overall financial position, and calculate it by taking our total
long-term debt, including the current portion, and subtracting cash and cash equivalents.
Media contact:
Nathalie Bourque, Vice President, Public Affairs and Global Communications, (514) 734-5788, [email protected]
Investor relations:
Andrew Arnovitz, Vice President, Investor Relations and Strategy, (514) 734-5760, [email protected]
